Application Insights – useful tool or a costs generator?
By Dawid on (tags: azure, categories: azure)Without a doubt Application Insights, so a set of tools which helps to monitor your application form from early stage of development thought going into the production is a useful tool. So why it could generate additional costs? I will try to answer that question bellow.
What it is?
As I’ve written Application Insights it’s set of useful tools which will be collecting metrics, application telemetry data (application activities and health), application trace logging data and provides much more of other features (e.g.: live metrics, Synthetic Transaction Monitoring or Github integration). If I would need to use once sentence to describe be it would say that it’s application performance management service for web applications.
How to use it in ASP.NET Core?
Configuration is quite simple:
- Go to Project > Add Application Insights Telemetry
- Choose Azure Application Insights, then select Next.
- Choose your subscription and Application Insights instance (or create a new instance with Create new), then select Next
- Add or confirm your Application Insights connection string
After you add Application Insights to your project, check to confirm that you're using the latest stable release of the SDK. Go to Project > Manage NuGet Packages... > Microsoft.ApplicationInsights.AspNetCore. If you need to, select Update.
Once required package is installed you can dive into the code and enable telemetry by adding AddApplicationInsightsTelemetry() to your startup.cs or program.cs class (depending on your .NET Core version):
// This method gets called by the runtime. Use this method to add services to the container.
var builder = WebApplication.CreateBuilder(args);

// The following line enables Application Insights telemetry collection.
builder.Services.AddApplicationInsightsTelemetry();

// This code adds other services for your application.
builder.Services.AddMvc();

var app = builder.Build();
Don’t forget to configure the connection string. Bellow example shows how to specify a connection string in appsetings.json file:
{
  "Logging": {
    "LogLevel": {
      "Default": "Information",
      "Microsoft.AspNetCore": "Warning"
    }
  },
  "AllowedHosts": "*",
  "ApplicationInsights": {
    "ConnectionString": "Copy connection string from Application Insights Resource Overview"
  }
}
Done! Starting from now on Applications Insights can collect following information’s for your ASP.NET Core application:
- requests
- dependencies
- exceptions
- performance counters
- heartbeats
- logs
Where are the costs?
Application Insights is not free, the costs come from the data that’s ingested and stored. If you will investigate the pricing table you will see that every ingested gigabyte of data Microsoft charge 2.7€. That is not cheap! Let say that your application is generating a gigabyte of data per day. That is not a lot, remember that Application Insights will store every log statement, outgoing and ingoing http call, every burp and sneeze. It will cost you around 80€ per month and we haven’t even brought a value to our users yet.
How to reduce costs?
There is couple of things we can do to reduce the cost of Application Insights. We can start with:
- disabling live metrics, dependency tracking and performance counters
- set correct log levels
- play with the sampling settings – more to be found here.
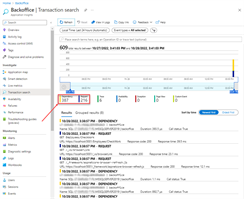
But this might not be enough as the largest chunks of that will still be metrics. Bellow example shows what is collected for a small web application after few clicks here and there:
Few clicks and we have plenty of dependency and request metrics collected. And that application is not even using custom events or page view metrics which can heavily increase the amount of that which will be stored by Application Insights!
But we can control it! Instead of calling default AddApplicationInsightsTelemetry() we can use overload which allow us to specify ApplicationInsightsServiceOptions options like that:
builder.Services.AddApplicationInsightsTelemetry(new ApplicationInsightsServiceOptions
{
    EnableDependencyTrackingTelemetryModule = false,
    EnableRequestTrackingTelemetryModule = false,
});
Thanks two disabling those two options we will stop Application Insights form storing all Dependency and Request metrics which in case of our test application were generating majority of traffic. You can find fill list of options here.
What if the basic configuration options are not enough?
If set of basic configurations options is not enough and you need some more advance filtering scenarios you can implement your own telemetry processors. For example if your application have a lot of static resources we can suppress static resources requests in the following way:
using Microsoft.ApplicationInsights.Channel;
using Microsoft.ApplicationInsights.DataContracts;
using Microsoft.ApplicationInsights.Extensibility;

namespace Sample
{
    public class SuppressStaticResourcesFilter : ITelemetryProcessor
    {
        private ITelemetryProcessor _next { get; set; }

        private static readonly List _staticResources = new List { "favicon.ico", "bootstrap", "jquery", "site.css", "site.js" };

        public SuppressStaticResourcesFilter(ITelemetryProcessor next)
        {
            _next = next;
        }

        public void Process(ITelemetry item)
        {
            var req = item as RequestTelemetry;
            if (req != null && _staticResources.Any(n => req.Name.Contains(n)))
            {
                return;
            }

            _next.Process(item);
        }
    }
}
Once the processor is done you can use it in the following way:
builder.Services.AddApplicationInsightsTelemetry();
builder.Services.AddApplicationInsightsTelemetryProcessor<SuppressStaticResourcesFilter>();
If you would like to diagnose only calls that are slow, filter our the fast ones:
public void Process(ITelemetry item)
{
    var request = item as DependencyTelemetry;

    if (request != null && request.Duration.TotalMilliseconds < 100)
    {
        return;
    }
    this.Next.Process(item);
}
 back
back

Mirek
11/7/2022 10:26 AM
Great post!Sandro
11/7/2022 2:38 PM
Very helpful analysis. I think it is worth mentioning, that for Azure Monitor (encompassing Application Insights) the first 5 GB of data ingress per billing account and month are free.